Redefining Climate Action Metrics: The Urgent Need for Time Weighted Impact
 — 16 minute read
A Wake-Up Call from Nature permalink
We live in an era where effects of climate change [1] are now witnessed first-hand, and are no longer merely predictions or contained within scientific journals - the hurricanes, the floods, the droughts, they are all realities now.
“Climate change is real; it is happening right now. It is the most urgent threat facing our entire species, and we need to work collectively together and stop procrastinating. Let us not take this planet for granted.” – Leonardo DiCaprio [2]
Rethinking Metrics for a Warming World permalink
“What gets measured, gets done” [3] has never been more pertinent, as quantifiable goals are crucial for driving action. The adage is simple, yet tricky in practice: Measure the wrong things, and the wrong things get done. Measure incorrectly, and things get done wrong [3:1]. The stakes of climate change are high for our species - nothing less than our collective future. In fact, today’s children are likely to witness its potentially catastrophic outcomes in their lifetimes. Metrics create incentives that drive our behaviours. Thus it follows that we must think critically about them, and avoid being led astray by poorly designed metrics.
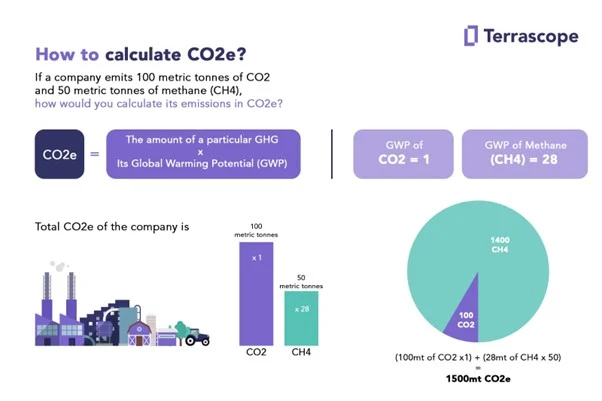
The unit kilograms of carbon dioxide equivalent (kg CO₂e) serves as the universal gauge for greenhouse gas (GHG) emissions [4]. This is where the various GHGs are given a global warming potential factor, and weighted accordingly. For example methane has a factor of approximately 30, therefore about 0.033 kg of methane counts as 1 kg of carbon dioxide equivalent [4:1].
While this is still the main unit of account that matters in scientifically calculating and forecasting the temperature of Earth, it is not the most useful unit of account for the actions that we take to curb further temperature increases. The singular focus on quantity overlooks a critical factor: Time.
The Proposal: kg CO₂e / year permalink
The impact of our GHG emissions is not static, but rather cumulative - akin to compound interest in finance. Immediate reductions are exponentially more valuable than the same quantity of reductions years from now.
“Early action is key to addressing climate change.” – Project Drawdown [5]
This makes clear the case for us to rethink metrics for our GHG reduction actions. Thus, this article proposes a new unit of account which inherently reflects the urgency required: Kilograms of carbon dioxide equivalent per year – kg CO₂e / year. This would be calculated by dividing the amount of GHG emissions reductions by time to calculate an estimated average value.
While the use of this unit may seem novel at first, it gives us a fresh perspective of the goal, and yields valuable new ideas around how to attain it.
The cumulative nature of GHG emissions mean that while the rate of the emissions reductions matter, how soon these reductions begin also matter. One way in which to incorporate these into calculations using the new metric is to define an epoch (a universal start time) [6]. For example, we could set the epoch to the year 2000. If one were to start an activity that removes 1000 kg CO₂e / year in the year 2025, that should be considered as effective as starting an activity that removes 2000 kg CO₂e / year in the year 2050. To reiterate: Early action is key to addressing climate change.
The following sections illustrate how this new metric could be applied, and reshape the thinking and processes in various sectors that have high potential for impact on curbing greenhouse gas emissions.
Investments: Prioritising Timely Impact per Dollar permalink
Both governments and venture capital have been making increasing investments, collectively known as “Climate Capital” [7]. Adapting the new proposed metric, we have: Dollars per kilogram of carbon dioxide equivalent per year ($ / kg CO₂e / year).
Consider a hypothetical decision between plugging methane leaks [8] at an oil refinery which takes weeks, and adding carbon capture and storage [9] at the same oil refinery which takes years. If both can deliver the same amount of GHG reductions and cost the same, in our current thinking based on the kg CO₂e metric, the same amount of capital is likely to be allocated to both projects.
However if we were to use the new metric instead, $ / kg CO₂e / year, the methane leaks option would be allocated much more capital compared to the carbon capture and storage option. Additionally, if the project plugging methane leaks can be implemented this year, but the project adding carbon capture and storage can only be added in about 15 years; and we apply the epoch logic, the capital allocation would skew even further towards the methane leaks option. This new way of prioritising capital allocation would have a much bigger impact on cumulative GHG emissions.
The new metric proves its inherent value, by demonstrating that it leads to better allocations.
Climate positive investments tend to be good investments too, with the “Carbon Clean 200”, an index tracking “companies leading the way with solutions for the transition to clean energy”, significantly beating the returns on broad market indices from 2016 through 2023 [10].
“It is now cheaper to save the world than destroy it. But is capitalism up to the challenge of preventing the climate crisis?” – Akshat Rathi [11]
Maximising Utility per Emission in Key Sectors permalink
The UN Environment Program has identified several key sectors[12] which need to curb their GHG emissions in order to limit Earth’s temperature rise to under 1.5°C.
The new metric, kilogram of carbon dioxide equivalent per year (kg CO₂e / year), can also be adapted to these sectors, following the pattern used for investments above. To do so, we take the baseline unit of measure of production in that sector (for example, kilowatt hours in the energy sector), and use that to make a sector-specific variation of the new metric. The table below does this for several sectors that have high potential impact on curbing GHG emissions.
| Sector | Baseline unit of measure | Sector-specific metric | Unit |
|---|---|---|---|
| Investment | Dollars | Dollars per kilogram of carbon dioxide equivalent per year | $ / kg CO₂e / year |
| Energy | Kilowatt hours | Kilowatt hours per kilogram of carbon dioxide equivalent per year | kWh / kg CO₂e / year |
| Transport | Passenger kilometres | Kilometres per kilogram of carbon dioxide equivalent per year | km / kg CO₂e / year |
| Agriculture | Kilojoules | Kilojoules per kilogram of carbon dioxide equivalent per year | kJ / kg CO₂e / year |
| Steel | Kilograms of Steel | Kilograms per kilogram of carbon dioxide equivalent per year | kg / kg CO₂e / year |
| Cement | Kilograms of Cement | Kilograms per kilogram of carbon dioxide equivalent per year | kg / kg CO₂e / year |
Each of these sectors should view the new metric as an opportunity to refactor their priorities. In essence, each sector should collectively ask itself how it can maximise the utility it provides to its customers in the shortest amount of time with the largest GHG reductions possible. This exercise is likely to yield a radical shift in priorities, and a redesign of processes.
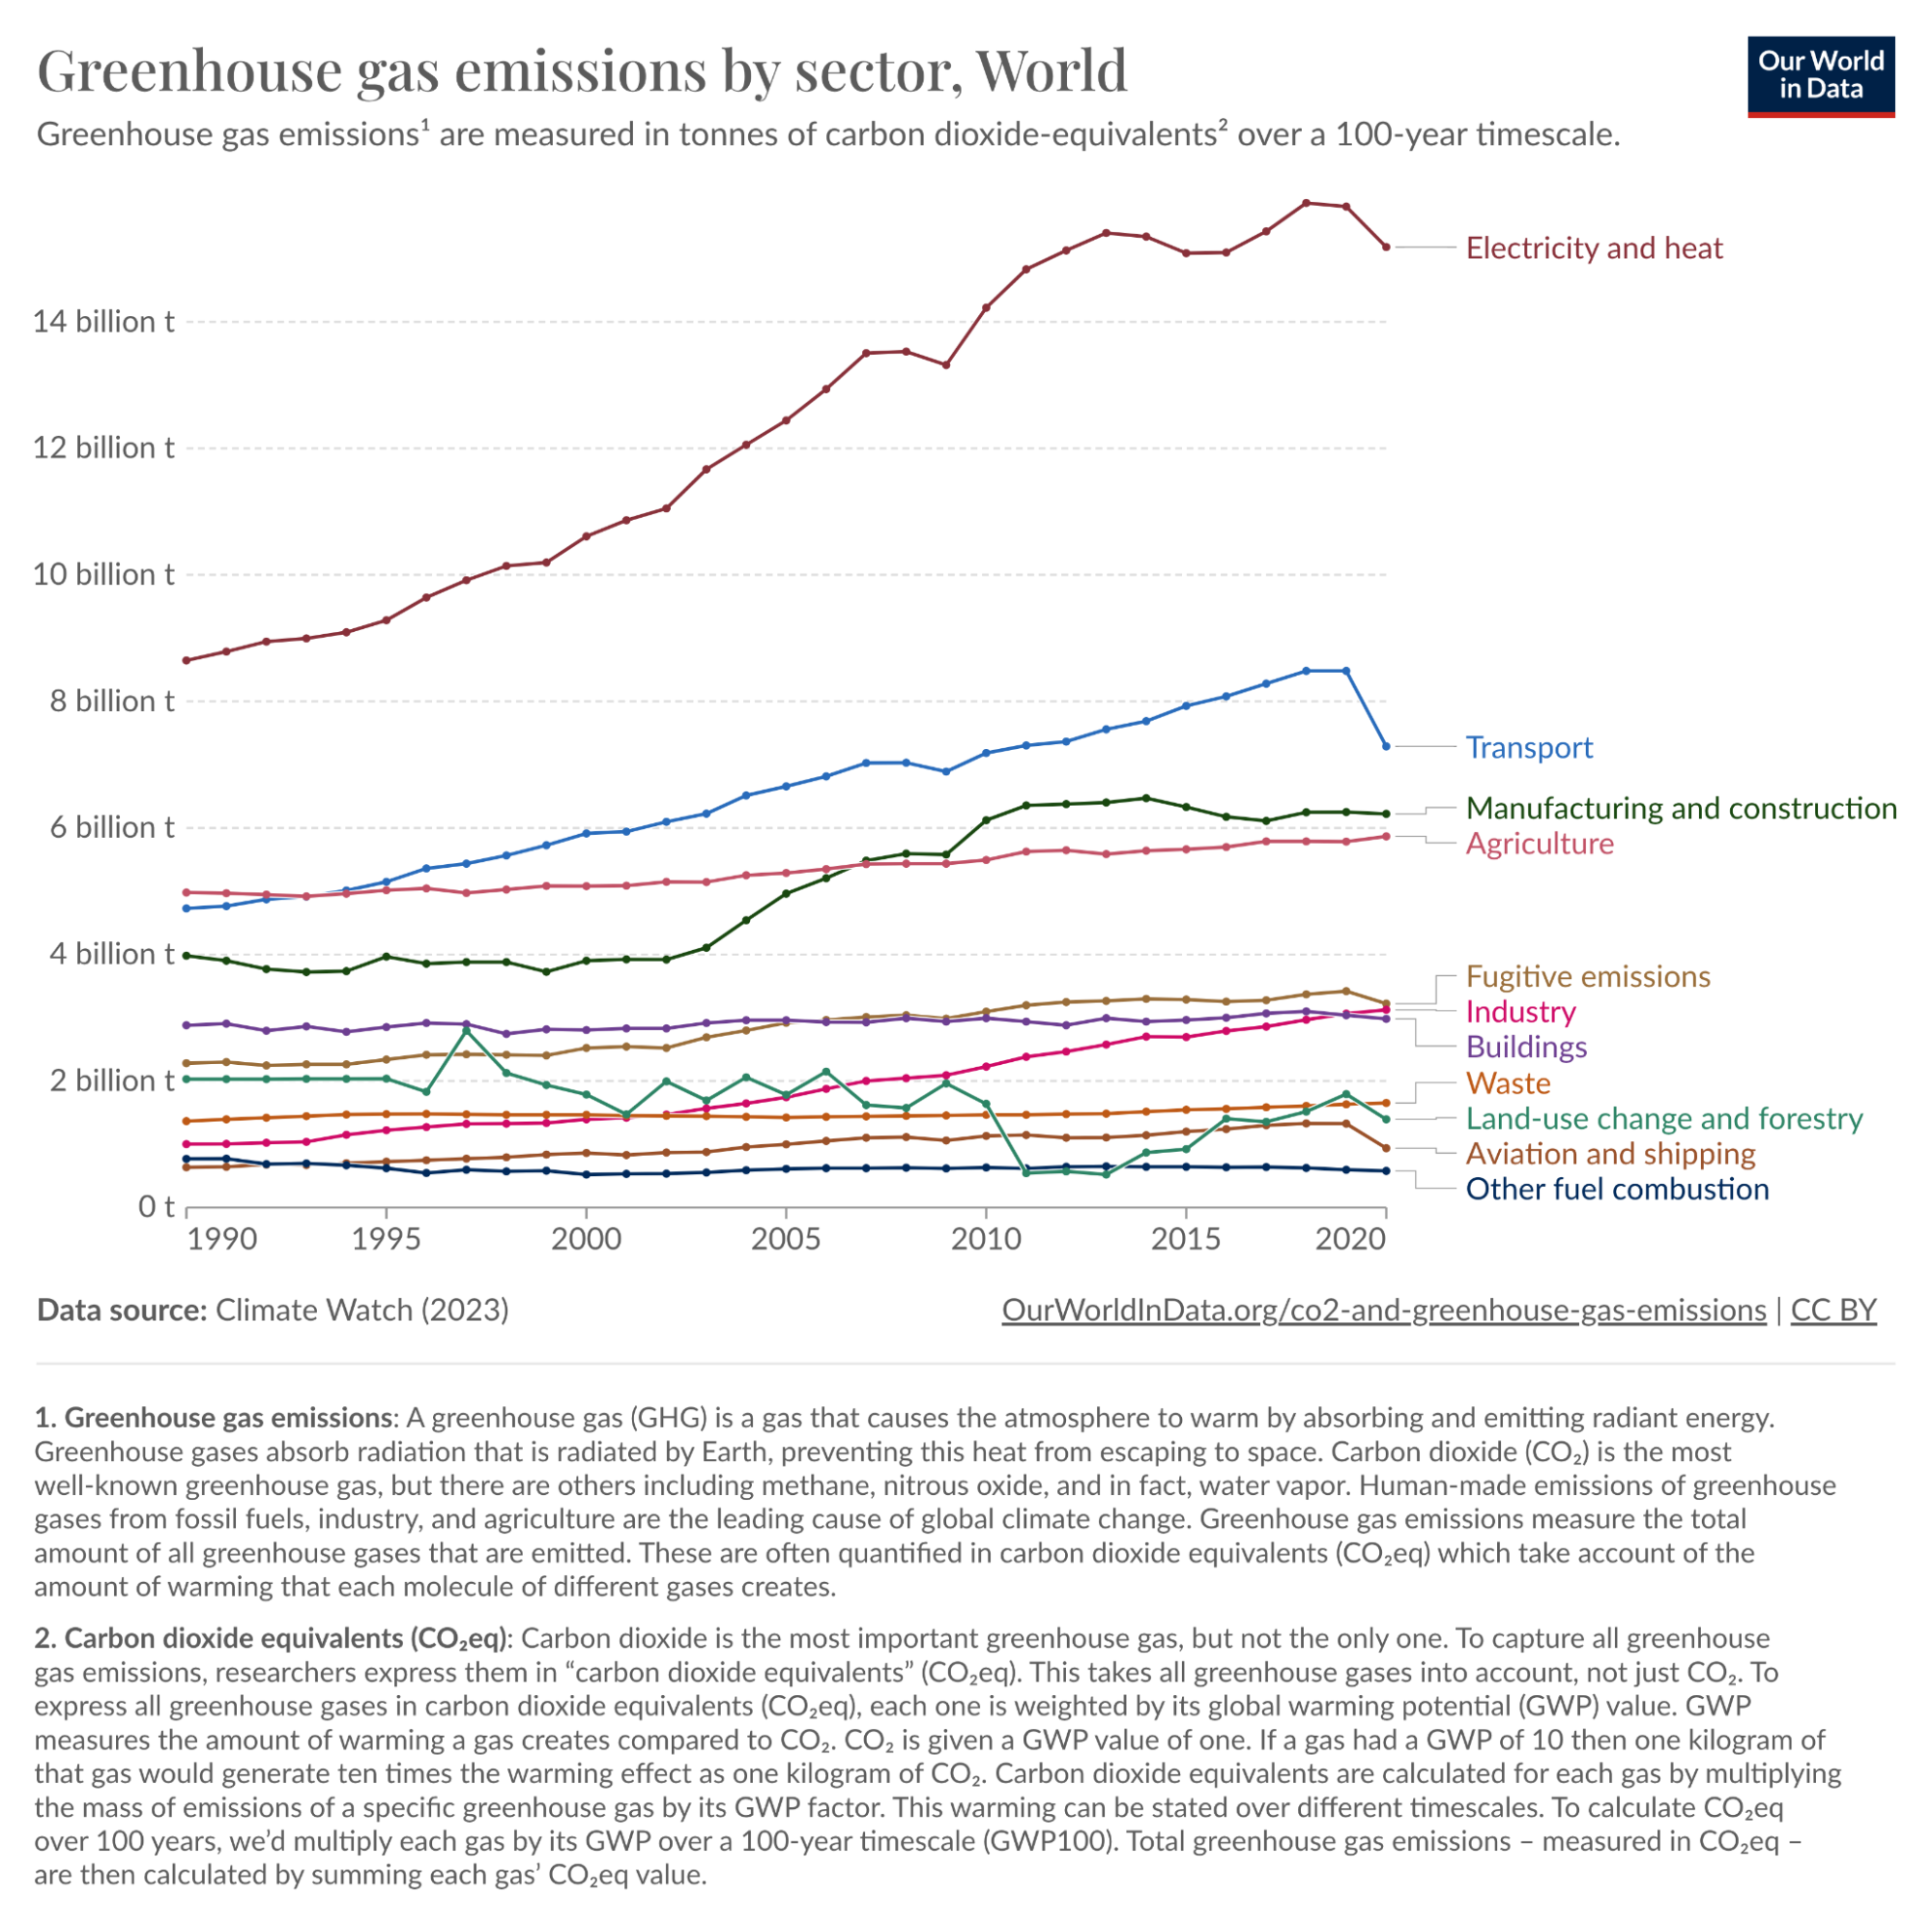
Emissions by sector: Where do greenhouse gases come from? – Our World In Data [13]
The Role of Governments permalink
Governments and regulators have a tremendous role to play here too. By and large, markets today fail to price the negative externalities from GHG emissions accurately. As a result, in most cases pollution remains profitable. Policies, legal/ regulatory/ tax frameworks can (and should) be created to incentivise or compel these critical sectors into climate optimal action within shorter time frames.
The nation of Norway has shown that this is possible. Its industrial sector has reduced GHG emissions by 40% while increasing production by 37%, and its buildings sector is responsible for only 2% of its GHG emissions (world average is 40%) [14]. It has accomplished this primarily through mass electrification plus ambitious government regulations on GHG emissions. Noteworthy: Norway has demonstrated that technologies, regulations, and processes that are available today are capable of the scale required to reduce GHG emissions on a national scale. Furthermore, they serve as a concrete example that reducing pollution can also be profitable.
A Call to Action: Aligning Metrics with Our Climate Goals permalink
We stand at a pivotal moment in history, where our actions can still alter the course of climate change. In COP21, we collectively agreed to limit temperature increases to 1.5°C above pre-industrial levels [15]. Yet we have regrettably marched in the wrong direction for the next 9 years, with our GHG emissions still increasing in 2024 [16]. We believe that the focus on metrics that do not factor in time has a large part to play in this.
“In the face of impending catastrophe, whose warning signs are already unbearably disastrous, weak action is unwise; no action is dangerous. At this point in the progression of this calamity, we have few choices and little time. Our discourse must focus on delivery, and our conversation must be centred on our commitments.” – William Ruto, President of Kenya [17]
It is not too late to steer back on course [18] by embracing new metrics that guide our efforts towards the actions that yield the most significant immediate benefits. When we put the right metrics in place, two key outcomes result:
- Simply showing the metrics to people automatically changes their behaviour, nudging them to improve those metrics.
- The actions needed to change those metrics are made much clearer.
While kg CO₂e is an appropriate unit for measuring climate impact, kg CO₂e / year is a more appropriate unit for measuring climate action.
Here is our clarion call: If you develop strategies or lead organisations in key sectors - energy, agriculture, industry, transportation, and buildings - you have the steering wheel. If you know someone in such positions, bring the matter up with them, and influence them to steer in the direction of timely climate optimal action.
Timely impact should be prioritised over eventual impact. Timing matters. Let us measure what really matters.
Thanks to Owanate Amachree, Graham Lally, Berwyn Powell, and Gunnstein Lye for reviewing this article.
Banner image [19].
Footnotes, with additional commentary.
This article assumes some prior knowledge about climate change. If you would like a primer, What is Climate Change has you covered.
Alternatively, if you prefer video, check out Climate Change: The View From MinuteEarth.
Friedman, L. (2016, February 29). Leonardo DiCaprio Uses Oscar Speech to Urge Action on Climate Change. Scientific American. https://www.scientificamerican.com/article/leonardo-dicaprio-uses-oscar-speech-to-urge-action-on-climate-change/
Leonardo used the intersection of celebrity and environmental activism well, and greatly enhanced the reach of the message. Pertinent was his use of the phrases “most urgent” and “stop procrastinating” back in 2015. ↩︎
On designing metrics and their measurements.
Caulkin, S. (2008, February 9). The rule is simple: Be careful what you measure. The Guardian. https://www.theguardian.com/business/2008/feb/10/businesscomment1
“What gets measured gets managed” is oft-quoted in management, but has many inherent pitfalls. This article points out several of them, including the chief one, which is when metrics that are chosen drive behaviour that is at odds with their original intent.
Pešec, B. (2021, January 28). How to design a metric that matters. https://www.pesec.no/how-to-design-a-metric-that-matters/
When designing metrics, an intent is used to derive the choice of metric, and the process typically stops there. This leaves out what should follow, which is an iterative approach of testing and refinement. ↩︎ ↩︎
Greenhouse gas (GHG) terms and calculations.
Terrascope. (2023, October 10). CO2e Meaning, Definition, Calculation, and Examples. https://www.terrascope.com/en-gb/blog/co2e-meaning-definition-calculation-and-examples
Nunez, C. (2022, May 9). Carbon dioxide levels are at a record high. Here’s what you need to know. National Geographic. https://www.nationalgeographic.com/environment/article/greenhouse-gases
Davis, G. & Brander, M. (2023, November 29). GHG, CO2, CO2e and Carbon: What do all these terms mean? Ecometrica. https://ecometrica.com/knowledge-bank/insights/ghg-co2-co2e-carbon-what-do-all-these-terms-mean/
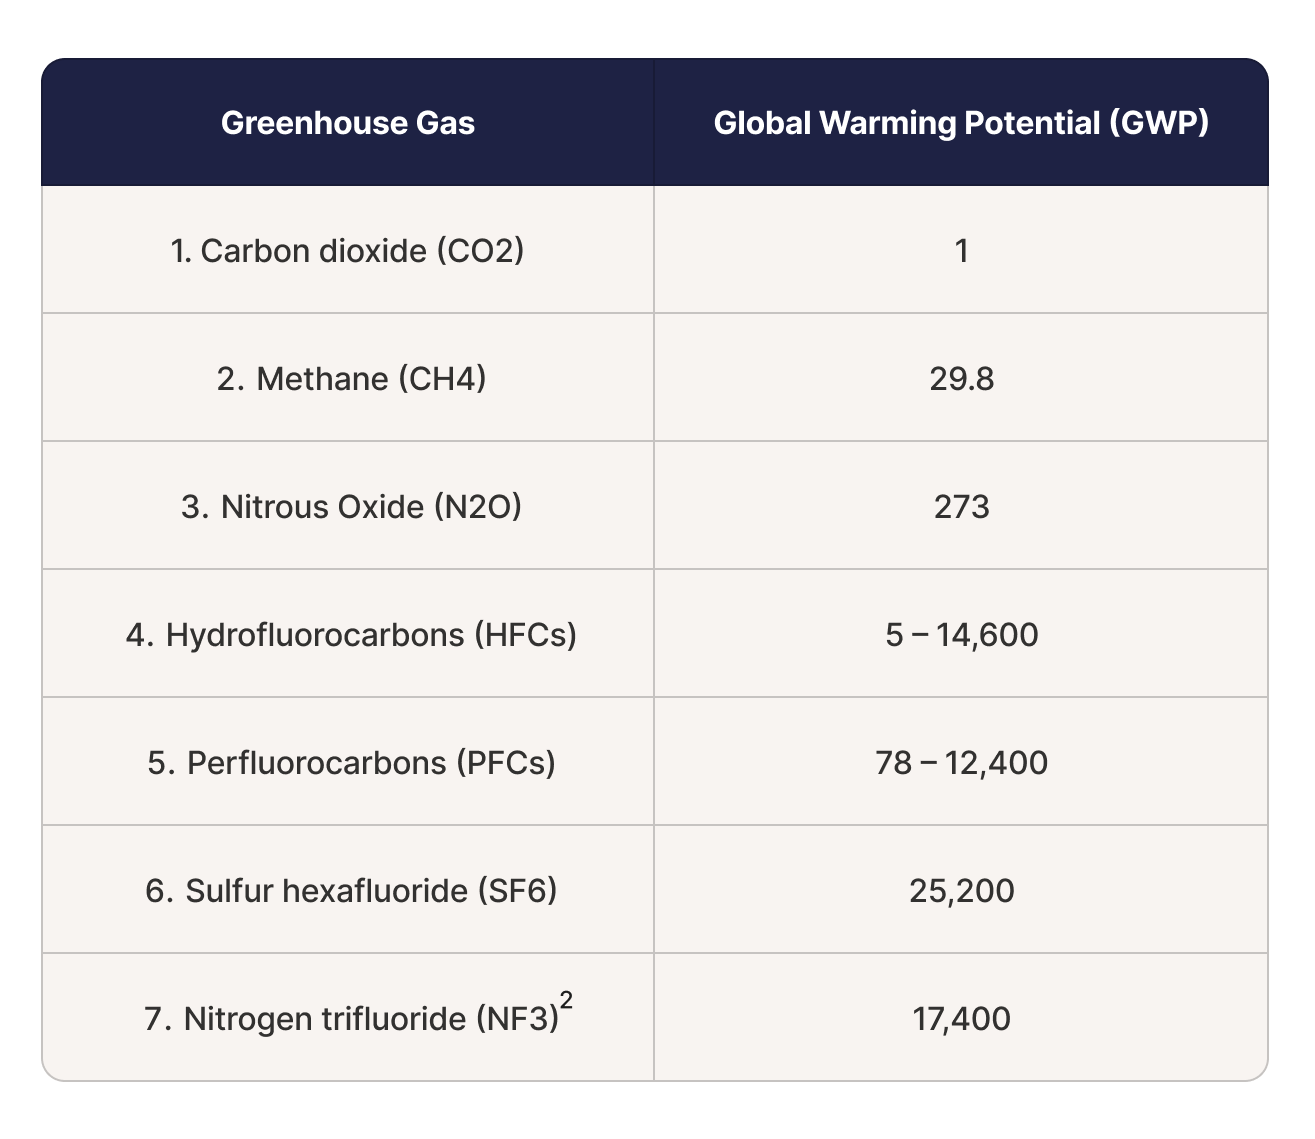
These three resources provide a primer on the technical terms related to GHG emissions, including a listing of the specific gases, global warming potential (GWP) of each of these gases, and how to use this to calculate their equivalents in carbon dioxide.
The latter includes this table:
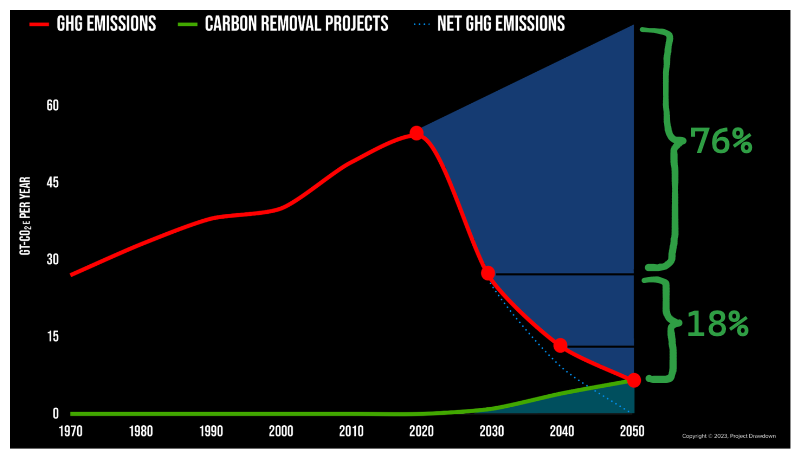
Project Drawdown. (2023, July 18). Drawdown Roadmap presented by Project Drawdown. https://drawdown.org/drawdown-roadmap
This chart very succinctly illustrates the power of early action on reducing GHG emissions, due to their cumulative nature. The emissions reductions in the decade of 2020 through 2030 alone will have the effect of 76% of all GHG emissions that need to be reduced when we (optimistically) attain net-zero emissions in 2050. That leaves only 18% of the GHG emissions reductions for the two decades of 2030 through 2050.
Mathematically, this is represented as the integral, which is the area between the curve of “business as usual” GHG emissions, and the curve of reduced GHG emissions.
Note that the annotations indicating
76%and18%have been added for emphasis, and were not a part of the original chart. ↩︎Epoch101. (n.d.). What is UNIX Time? https://www.epoch101.com/What-is-Unix-Time
Many computer systems have standardised on 2023/01/01 as the epoch, and store/ represent dates and times using a single number (of seconds since this epoch). This epoch works because of standardisation - if different computers need to communicate dates and times to each other, as long as they use the same epoch, the same numbers will represent the same dates and times on the different computers.
In a similar vein, an epoch chosen for climate change actions, to be used in conjunction with the newly proposed metric, should also be standardised across different projects quantifying their actions. ↩︎
Climate Tech Venture Capital. (2024, January 23). The Sophisticating Climate Capital Stack. Sightline Climate. https://www.ctvc.co/the-sophisticating-climate-capital-stack/
This article details the various categories of investors that fund climate technology startups and companies. ↩︎
Mathur, S. (2023, March 8). Plugging the Leaks: Investor Guide to Oil and Gas Methane Risk. Environmental Defence Fund, Business. https://business.edf.org/insights/methane101-oil-gas/ ↩︎
National Grid Group. (n.d.). Energy Explained: What is carbon capture and storage? https://www.nationalgrid.com/stories/energy-explained/what-is-ccs-how-does-it-work ↩︎
Heaps, T. & Behar, A. (2023). Carbon Clean 200®: Investing in a Clean Energy Future 2023 Performance Update. As You Sow. https://www.asyousow.org/report-page/2023-clean200-investing-in-a-clean-energy-future
Clean200 is a list of the 200 largest corporations that demonstrate being environmentally clean is possible and profitable. Their screening methodology uses criteria that are significantly more stringent than current ESG methodologies. ↩︎
Rathi, A. (2023, October 12). Can Climate Capitalism Work? (Bindrim, Interviewer). Zero: The Climate Race. https://www.bloomberg.com/news/audio/2023-10-11/can-climate-capitalism-work-podcast
In this podcast, Akshat is optimistic that climate capital will help to solve climate change, because we are now past a critical techno-economic tipping point where it has become profitable to do so. ↩︎
United Nations Environment Program. (2021, November 9). The six-sector solution to the climate crisis. https://www.unep.org/news-and-stories/video/six-sector-solution-climate-crisis
This includes a video for each of the sectors, and introduces the sector-based approach to GHG emissions reduction well. ↩︎
Ritchie, H., Pablo R., & Roser, M. (2024, January 5). Emissions by sector: where do greenhouse gases come from? Our World in Data. https://ourworldindata.org/emissions-by-sector
Shows GHG emissions by sector using several interactive time-series charts. ↩︎
Hordnes, E. (2019). 2019 Urban Energy Report: Race to Electrification - Norway in Pole Position. Sweco Group. https://www.swecogroup.com/urban-insight/energy/report-race-to-electrification-norway-in-a-pole-position/
A case study on Norway’s national GHG reduction strategies and successes. Norway can serve as a role model. Other countries would do well to draw from its approach, copying and adapting specific policies or measures to their national circumstances. ↩︎
United Nations Framework Convention on Climate Change. (2015, December 12). The Paris Agreement. https://unfccc.int/process-and-meetings/the-paris-agreement
This was the landmark year for the world as far as climate change is concerned, where countries first agreed upon the now de-facto “1.5°C”. This was also where all countries agreed to collectively submit nationally determined contributions (NDCs), which are their climate change action plans, on a multi-year cycle. ↩︎
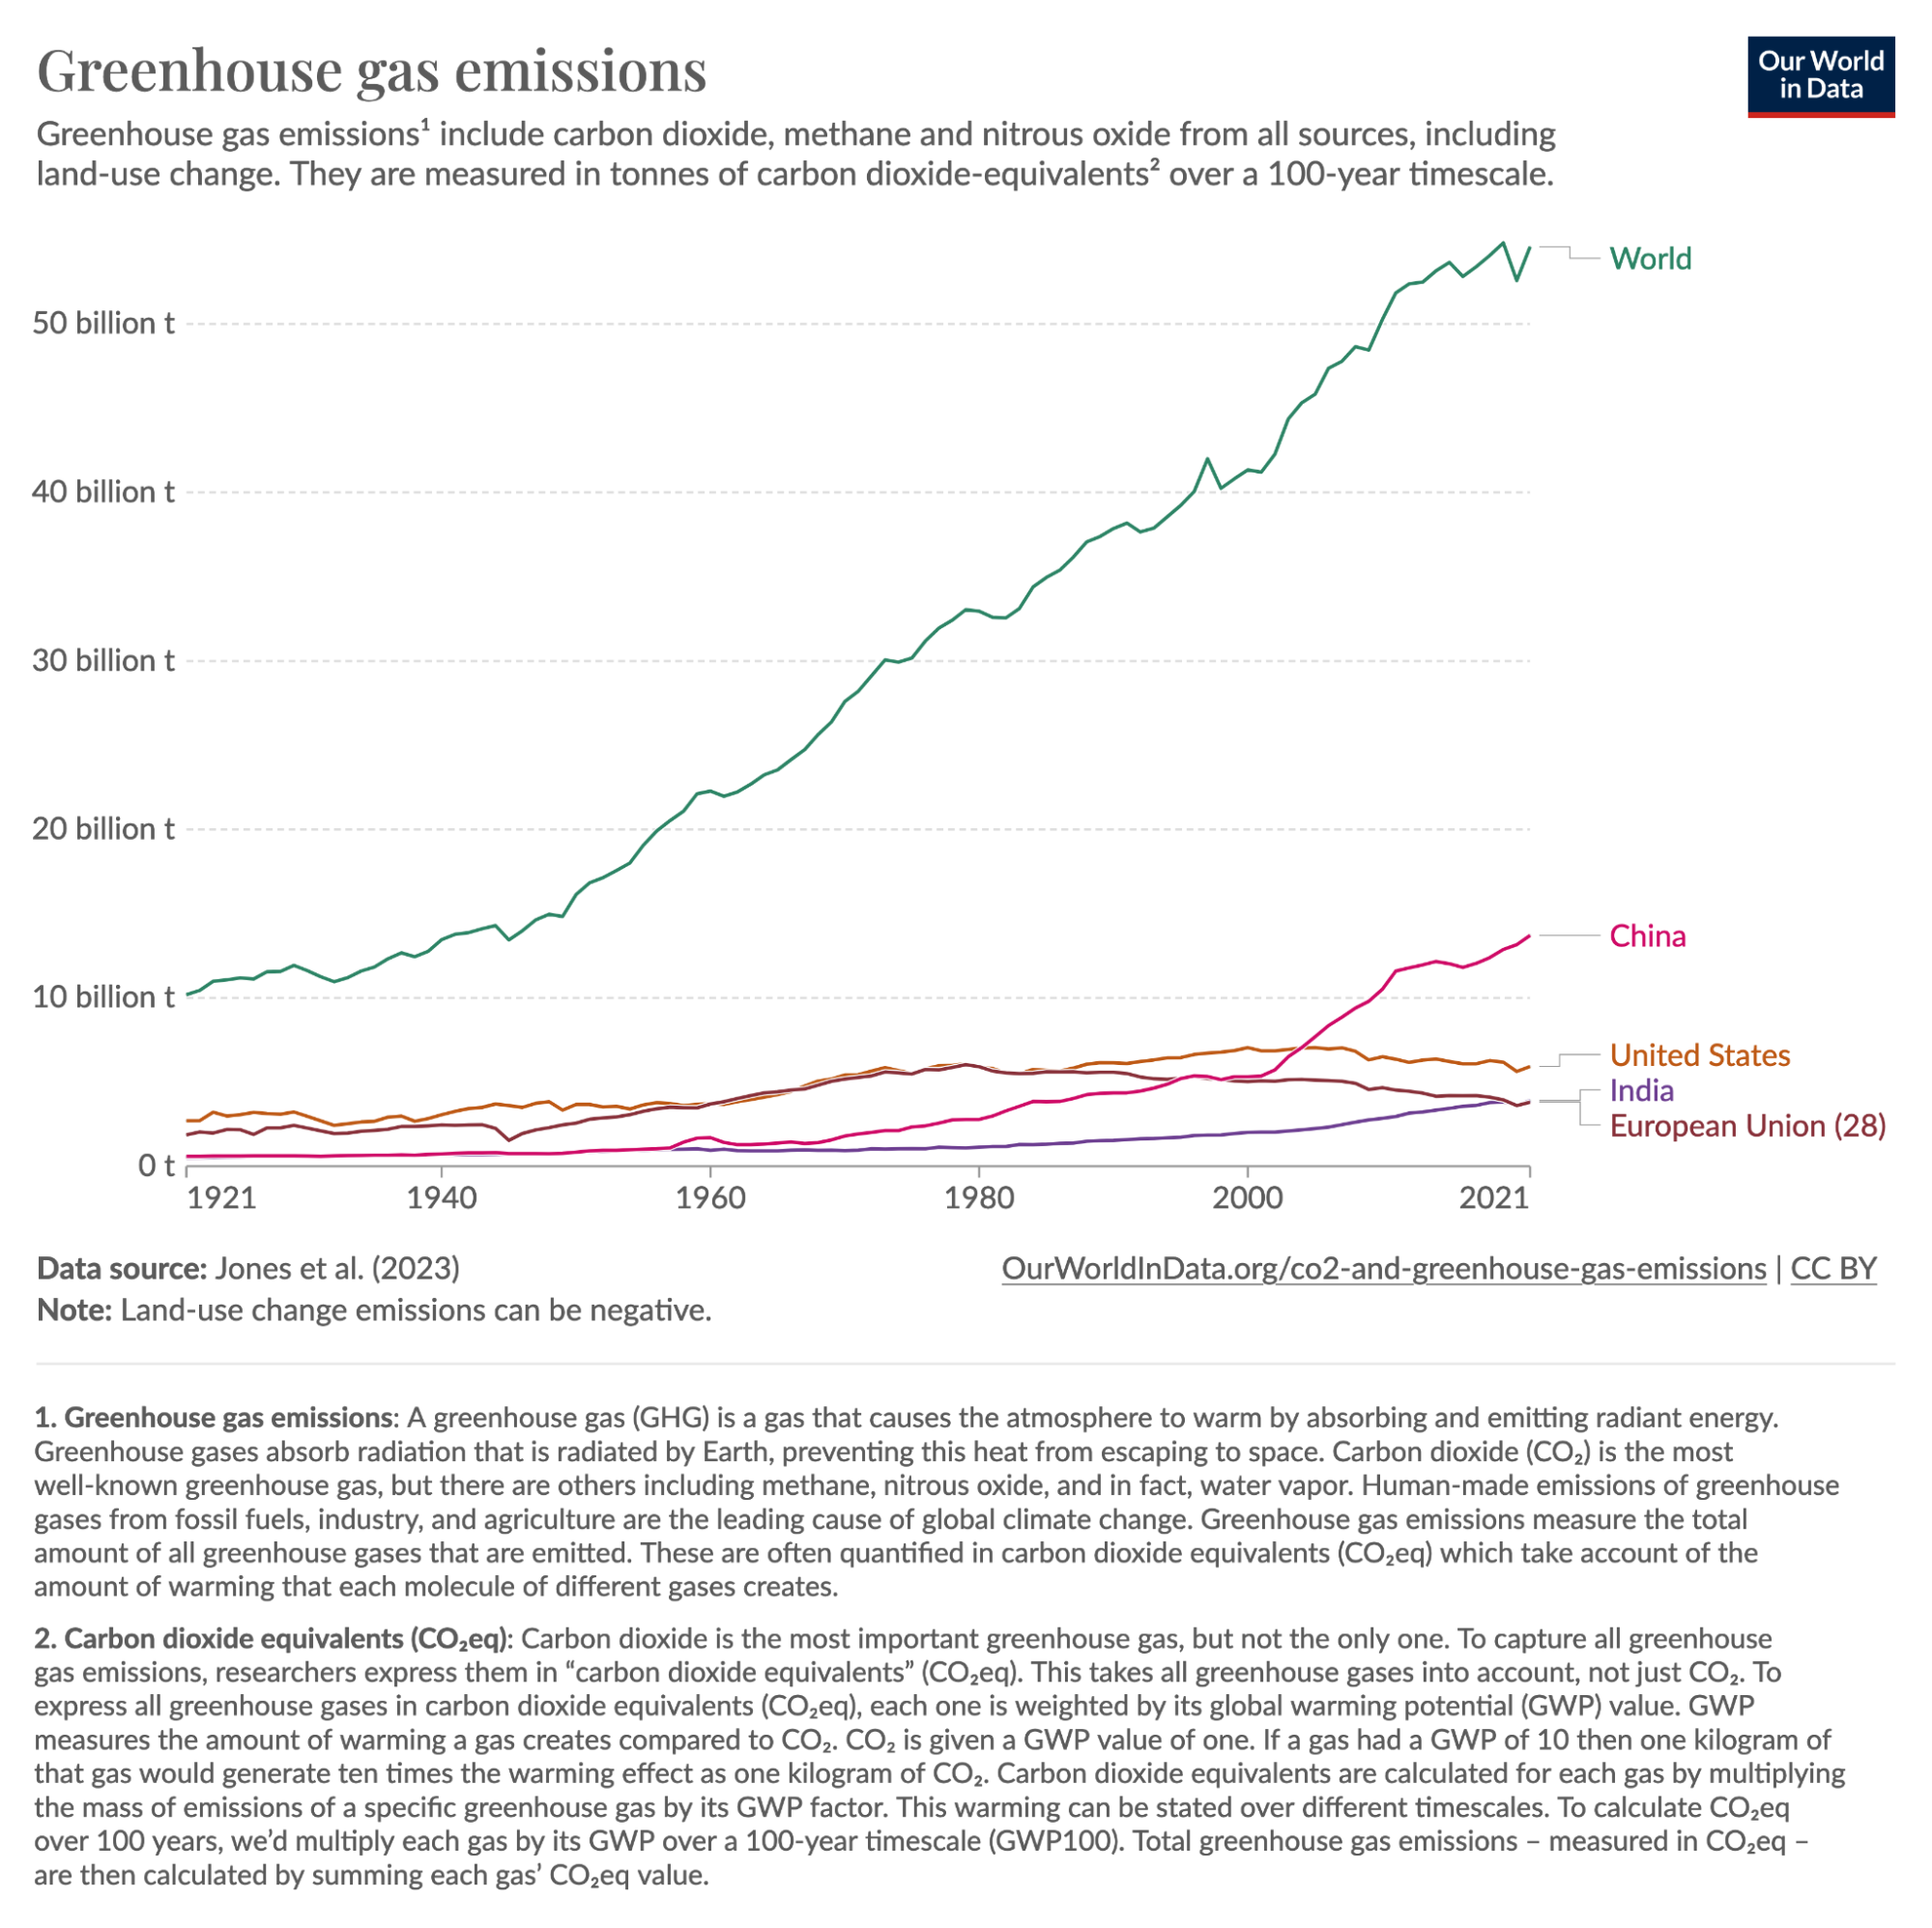
Ritchie, H., Pablo R., & Roser, M. (2023, December 28). CO₂ and Greenhouse Gas Emissions. Our World in Data. https://ourworldindata.org/co2-and-greenhouse-gas-emissions
Shows GHG emissions for the world as a whole, and the largest economies using an interactive time-series chart. While GHG emissions are shrinking slightly in the West, the GHG emissions in the rest of the world (led by China) are growing much faster. The net result is that we are still rapidly headed in the wrong direction.
George, S. (2022, November 8). COP27: Who said what at the World Leaders Summit? Edie. https://www.edie.net/cop27-who-said-what-at-the-world-leaders-summit/ ↩︎
Intergovernmental Panel on Climate Change. (2023, August 17). Chapter 3: Mitigation Pathways Compatible with Long-term Goals. Climate Change 2022 - Mitigation of Climate Change, 295–408. Cambridge University Press. https://doi.org/10.1017/9781009157926.005
See figure 3.11 from section “3.3.2.1 Overall Mitigation Profiles and Temperature Consequences”.
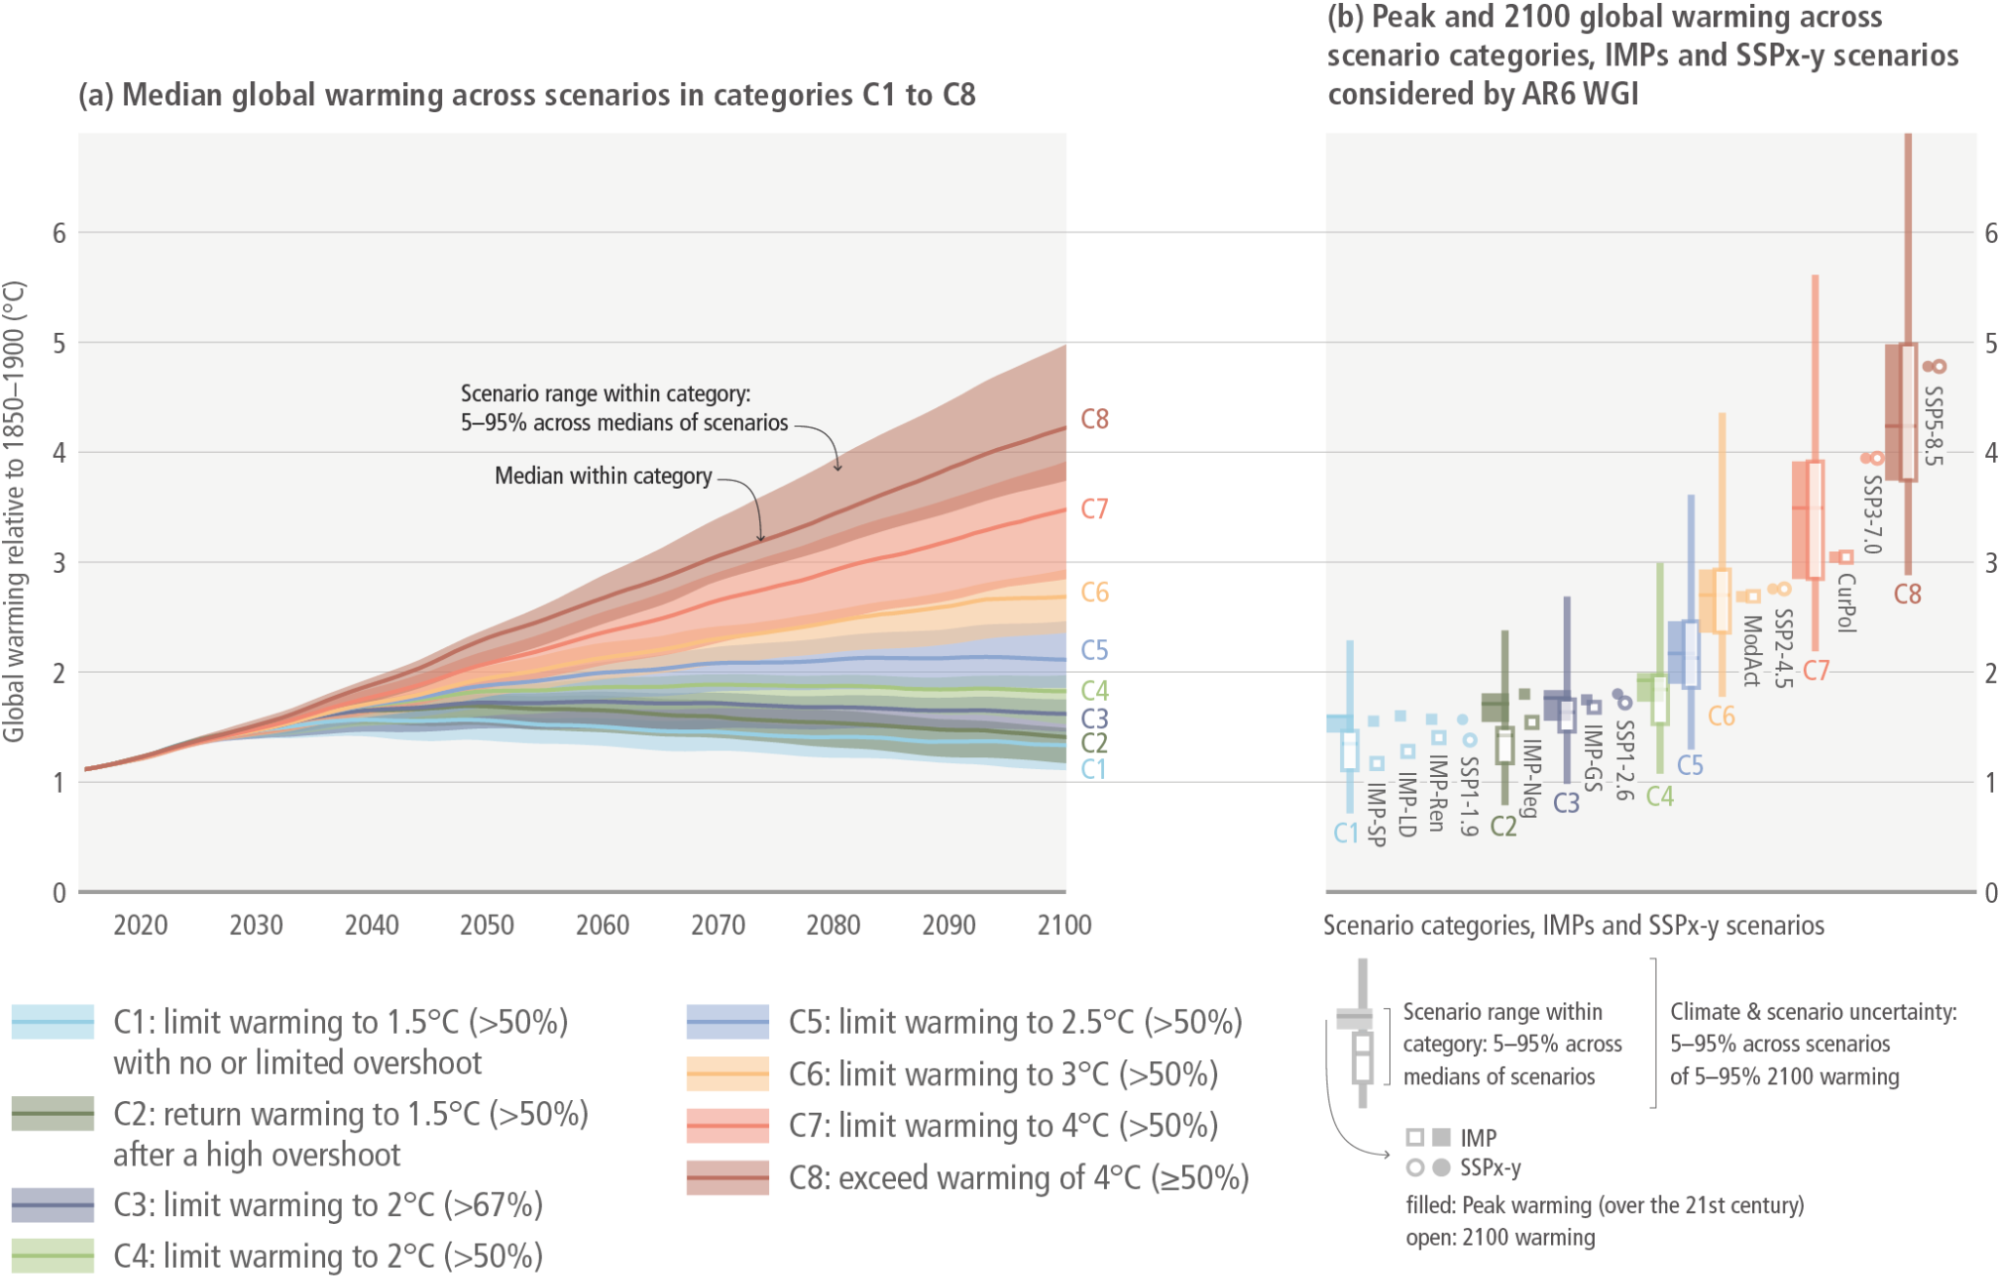
This figure shows that for the various scenarios it has considered (C1 through C8), the two with the lowest emissions (C1 and C2), are able to achieve staying under 1.5°C of warming, albeit temporarily crossing this threshold.
This report is also accessible from: https://www.ipcc.ch/report/ar6/wg3/chapter/chapter-3/ ↩︎
Zaman, S. (2016, July 16). The Prague Astronomical Clock Tower. Pexels. https://www.pexels.com/photo/the-prague-astronomical-clock-tower-4610741/ ↩︎